UX Research
BIG-O-TIRES
BIG-O-TIRES
Year :
2020
Industry :
Automotive
Client :
TBC Corporation
Project Duration :
3 Months

Enter password to view case study
🛑 THE PROBLEM:
The goal of this research was to understand how consumers navigate and interact with the Big O Tires website compared to five direct competitors. By analyzing real user behavior and evaluating each site across key UX metrics—such as usability, learnability, visual design, performance, trust, and purchase confidence—the study aimed to uncover pain points, identify friction in the customer journey, and reveal opportunities to improve conversions and overall user satisfaction across all business units.
🔎 RESEARCH & FOUNDATIONS:
🏁 Competitors | 🎯 Target Users |
|---|---|
To understand how Big O Tires performs within its competitive landscape, we evaluated five major industry competitors offering similar products and services:
These competitors were selected based on market relevance, online traffic volume, product availability, national retail presence, and similarity in purchase flows. Evaluating their websites allowed us to benchmark best practices, identify UX gaps, and uncover opportunities for Big O Tires to differentiate its digital experience. | The study focused on real consumers within Big O Tires’ active service regions, ensuring the results reflected accurate customer behavior and purchasing expectations.
|
🌍 Geographical Coverage | ✔️ Task Flows Tested |
|---|---|
Participants were selected from all U.S. states where Big O Tires operates, including: This ensured the sample represented a broad, realistic mix of customers across different regions, climates, and store networks. | Users completed real purchase and service flows:
This combination of flows and metrics allowed us to capture both quantitative performance and qualitative user sentiment across all platforms. |
📊 Metrics Evaluated
To measure the effectiveness of each website and identify opportunities for improvement, we assessed all six platforms using standardized UX and behavioral metrics:
✔️ Usability: How easy it is for users to complete key tasks.
✔️ Learnability: How quickly new users understand the system.
✔️ Visual Aesthetics: How users perceive the visual design, branding, and UI clarity.
✔️ Confidence to Buy: How much trust the platform creates during the purchase process.
✔️ Consumer Satisfaction: How satisfied users feel with prices, offers, installation options, and overall value.
✔️ Consumer Preference: Which website users prefer—and why—based on their experience.
🔍 UX Research & Testing Methodology
To understand how Big O Tires performs compared to its competitors, a large-scale usability study was conducted involving 120 participants across desktop and mobile experiences. Because testing all five competitors in one session would overwhelm users and compromise the quality of their feedback, the evaluation was strategically divided into three rounds.
This structure ensured that each participant could fully explore the websites, complete key tasks, and provide accurate, unbiased responses without cognitive fatigue.
📋 ATTRIBUTES ANALYSIS:
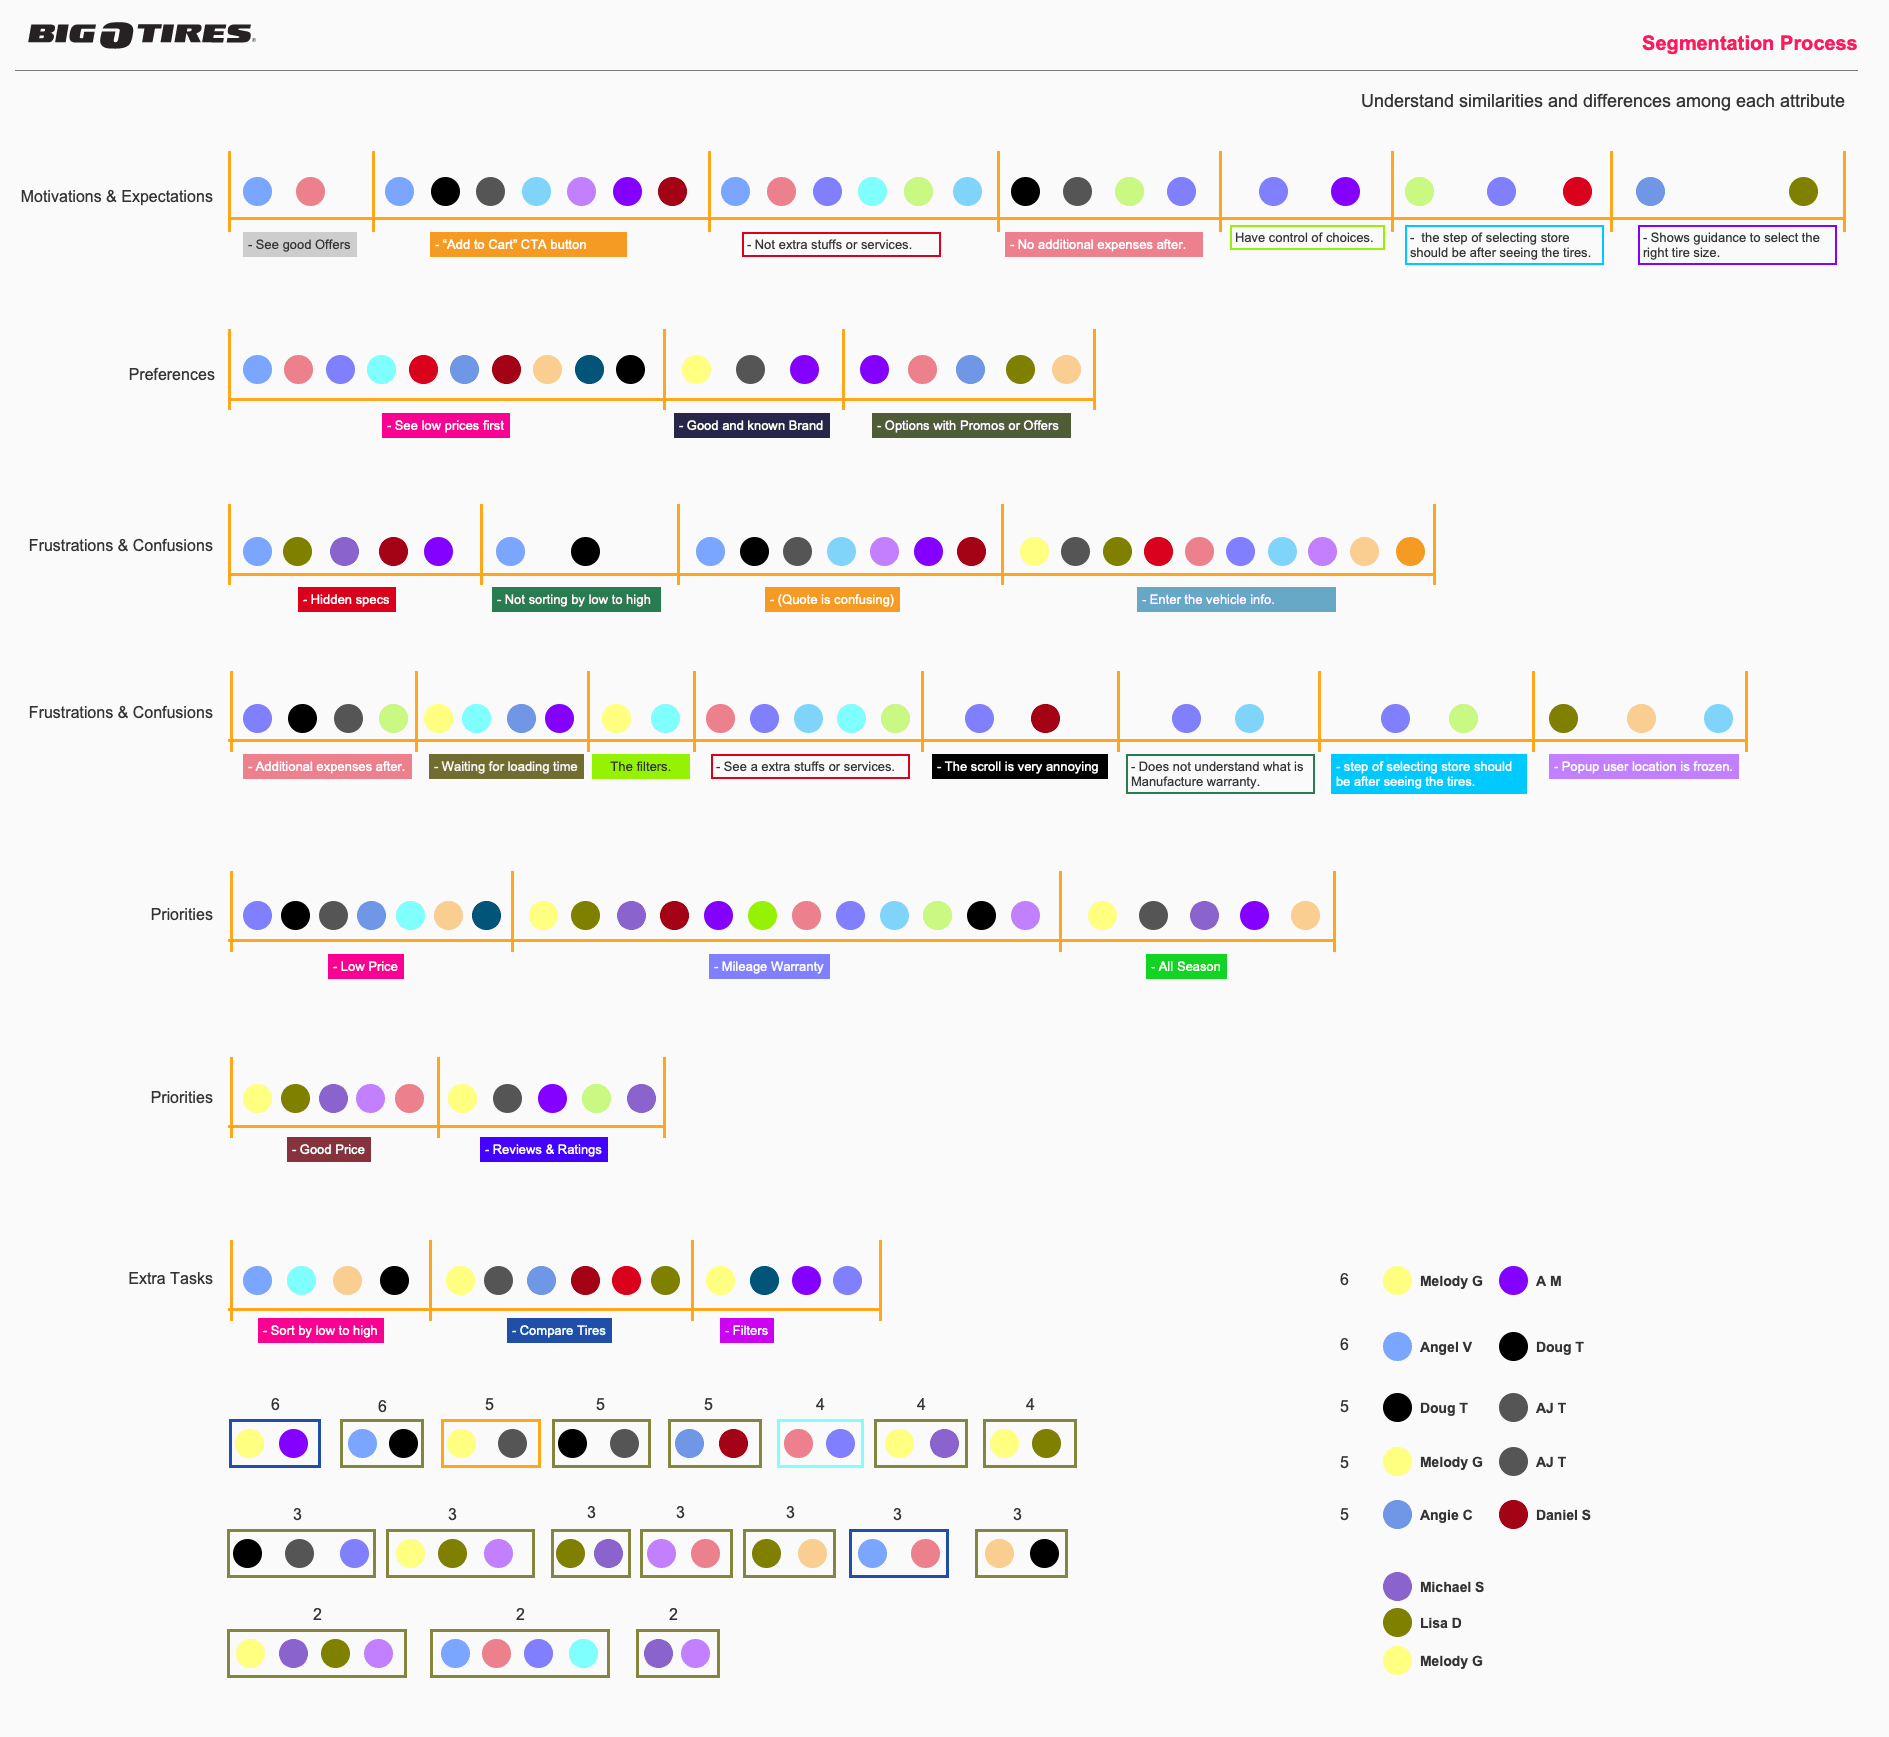
To build accurate and meaningful personas, I began by analyzing the specific attributes that differentiate users—such as goals, behaviors, experience levels, frustrations, motivations, and usage patterns. This step helped reveal what truly matters to each group and which characteristics influence how they interact with the product. By identifying shared traits and key differences, we were able to understand the spectrum of user needs with clarity.

🔀 SEGMENTATION PROCESS:
Once the attributes were defined, I organized users into logical segments based on their common behaviors and expectations. The segmentation process grouped users in a way that highlighted their unique decision-making patterns, skill levels, and priorities. These segments served as the foundation for developing personas that accurately represent real user clusters, ensuring the design solutions address the needs of each group effectively.
👤 PERSONAS
After completing the Attribute Analysis and Segmentation Process, I identified clear patterns in user goals, behaviors, frustrations, and decision-making styles. These insights revealed distinct groups within the customer base, allowing us to define two primary personas—representing the highest-value and highest-frequency user segments—and two secondary personas, which captured important but less dominant segments.
The personas were created as evidence-based profiles, each grounded in real user needs and behavioral trends observed during research. These personas guided design decisions by helping the team stay aligned with user expectations, technical constraints, and business goals throughout the project.


📝 SCENARIOS:
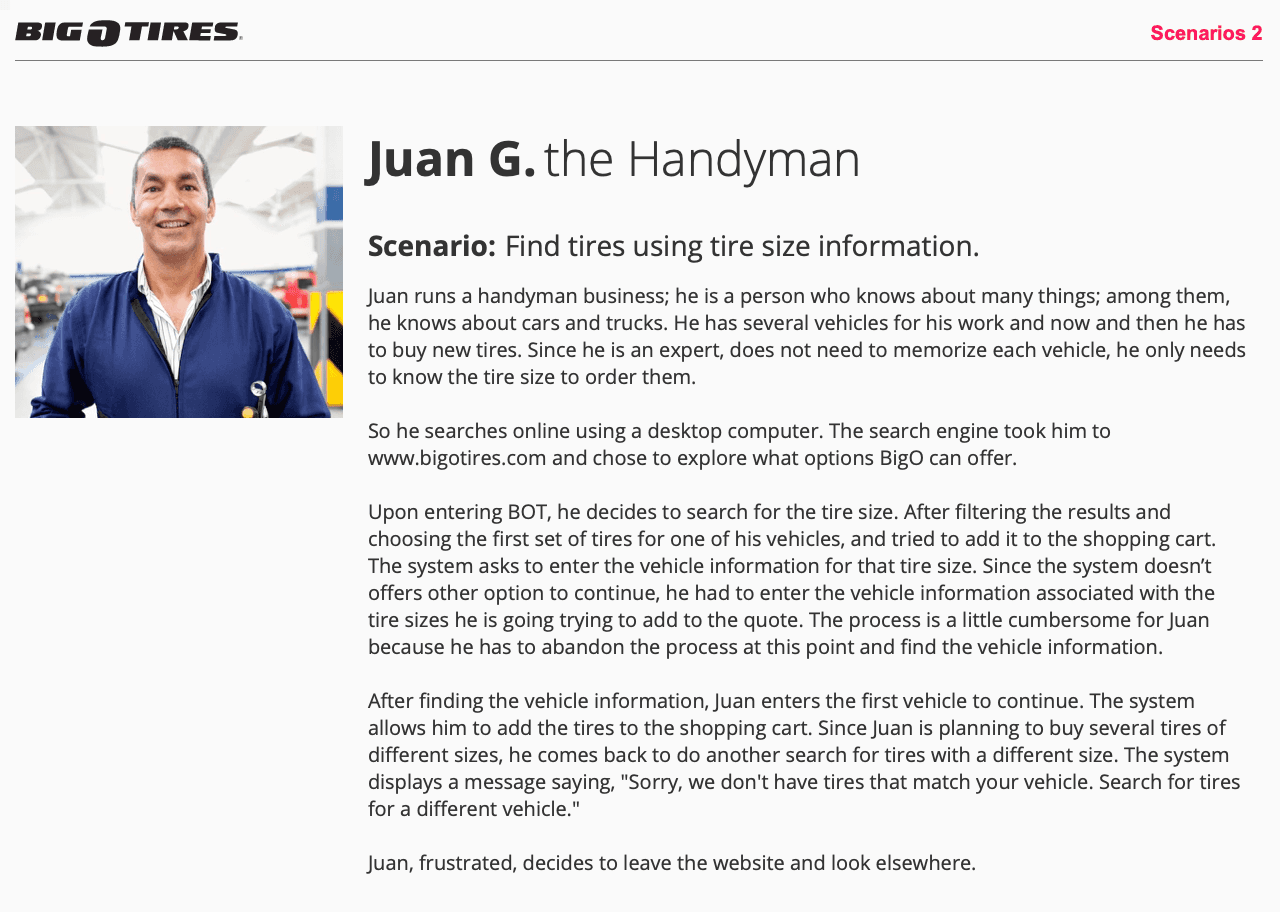
With the personas established, I created detailed scenarios that illustrate how each persona would naturally interact with the Big O’ Tires website under real conditions. These scenarios helped contextualize their goals, challenges, motivations, and pain points, giving the team a clearer understanding of the user journey from start to finish.
The scenarios also ensured that every design solution was anchored in realistic behaviors rather than assumptions—bridging the gap between research insights and UX decision-making. They became an essential tool for validating flows, prioritizing features, and aligning stakeholders around the needs of the primary and secondary personas.



🗺️ CUSTOMER JOURNEY MAPS:
Using the insights gathered from the Usability Testing sessions and the behavioral patterns defined in the Personas, I created detailed Customer Journey Maps to visualize how each user type experiences the Big O’ Tires website from beginning to end. These journeys reveal not only what users do, but also what they think and feel at each step—highlighting moments of confusion, frustration, hesitation, or confidence.
By grounding the Journey Maps in real research data, each stage reflects authentic user behavior, pain points, motivations, and expectations. The maps made it easy to identify where users were getting stuck, where drop-offs occurred, and which touchpoints created friction or uncertainty. They also helped the team understand how emotional responses impacted decision-making during the booking and tire-selection process.
These Customer Journey Maps became a critical alignment tool for product, design, and business teams. They ensured that improvement opportunities were directly tied to user needs and validated insights—allowing us to prioritize solutions that would create the most meaningful impact across the user experience.


🚀 The Solution:
🧪 Prototype:
⚠️ CHALLENGES:
Redesigning the Big O’ Tires digital experience revealed several systemic challenges across all user segments and device types:
1. High friction during the vehicle-information step
Users consistently struggled to enter their vehicle details due to unclear labels, inconsistent field order, dropdown issues, and unexpected keyboard triggers. This early frustration created a negative emotional baseline that affected the rest of the journey.
2. Confusing and repetitive steps across the flow
Multiple mandatory steps—such as reconfirming tire size or re-entering information—were perceived as redundant. Users questioned why the flow forced them through actions unrelated to their primary goal, leading to frustration and perceived inefficiency.
3. Low transparency of tire specs, promos, and warranties
Users had difficulty finding tire specifications, understanding promotions, and comparing warranties. Important details were hidden behind clicks, scattered across different pages, or not shown at the right moment in the decision process.
4. Overwhelming and inconsistent results pages
The tire results view showed too much information at once and lacked clear filtering, sorting, and scanning hierarchy. Users could not easily compare products, leading to confusion, cognitive overload, and lower confidence in their purchase decisions.
5. Slow performance and loading times
Delays—especially in comparison pages or store-location lookups—created frustration, causing some users to restart the flow or abandon it entirely.
6. Additional services and fees created distrust
Users consistently reacted negatively when unexpected installation fees or add-ons appeared late in the flow. This impacted trust and reduced overall satisfaction.
7. Emotional drop in the mid-journey
All journey maps showed a noticeable emotional decline around the tire results, comparison, and quote steps. These moments—where buying confidence should increase—instead produced confusion and frustration.
📄 SUMMARY:
The research revealed that the Big O’ Tires digital experience struggles to support the user’s mental model across the tire-shopping journey. While users enter the website motivated by price, convenience, and warranty expectations, their experience quickly declines due to friction in basic tasks, lack of clarity in product details, and repeated interruptions in the purchase flow.
Across 120 participants and multiple rounds of competitor benchmarking, users consistently expressed:
High cognitive effort during early inputs
Low satisfaction with the results and comparison pages
Confusion with quotes and additional fees
Reduced confidence to buy compared to top competitors
A strong desire for clarity, speed, and transparency
Despite these challenges, the research uncovered a clear roadmap for improvement: simplifying the entry steps, improving sorting and filtering mechanisms, making specs and promotions instantly visible, reducing unnecessary steps, and increasing overall system speed.
👤 My Role
Product Designer
📦 Key Deliverables
Wireframes (Axure RP)
Interactive Prototypes (Axure RP)
Usability Testing Reports
Design Specifications
Personas
Customer Journey Maps
Hi-Fidelity UI Solution explained.


More Projects


UX Research
BIG-O-TIRES
BIG-O-TIRES
Year :
2020
Industry :
Automotive
Client :
TBC Corporation
Project Duration :
3 Months
Enter password to view case study
🛑 THE PROBLEM:
The goal of this research was to understand how consumers navigate and interact with the Big O Tires website compared to five direct competitors. By analyzing real user behavior and evaluating each site across key UX metrics—such as usability, learnability, visual design, performance, trust, and purchase confidence—the study aimed to uncover pain points, identify friction in the customer journey, and reveal opportunities to improve conversions and overall user satisfaction across all business units.
🔎 RESEARCH & FOUNDATIONS:
🏁 Competitors | 🎯 Target Users |
|---|---|
To understand how Big O Tires performs within its competitive landscape, we evaluated five major industry competitors offering similar products and services:
These competitors were selected based on market relevance, online traffic volume, product availability, national retail presence, and similarity in purchase flows. Evaluating their websites allowed us to benchmark best practices, identify UX gaps, and uncover opportunities for Big O Tires to differentiate its digital experience. | The study focused on real consumers within Big O Tires’ active service regions, ensuring the results reflected accurate customer behavior and purchasing expectations.
|
🌍 Geographical Coverage | ✔️ Task Flows Tested |
|---|---|
Participants were selected from all U.S. states where Big O Tires operates, including: This ensured the sample represented a broad, realistic mix of customers across different regions, climates, and store networks. | Users completed real purchase and service flows:
This combination of flows and metrics allowed us to capture both quantitative performance and qualitative user sentiment across all platforms. |
📊 Metrics Evaluated
To measure the effectiveness of each website and identify opportunities for improvement, we assessed all six platforms using standardized UX and behavioral metrics:
✔️ Usability: How easy it is for users to complete key tasks.
✔️ Learnability: How quickly new users understand the system.
✔️ Visual Aesthetics: How users perceive the visual design, branding, and UI clarity.
✔️ Confidence to Buy: How much trust the platform creates during the purchase process.
✔️ Consumer Satisfaction: How satisfied users feel with prices, offers, installation options, and overall value.
✔️ Consumer Preference: Which website users prefer—and why—based on their experience.
🔍 UX Research & Testing Methodology
To understand how Big O Tires performs compared to its competitors, a large-scale usability study was conducted involving 120 participants across desktop and mobile experiences. Because testing all five competitors in one session would overwhelm users and compromise the quality of their feedback, the evaluation was strategically divided into three rounds.
This structure ensured that each participant could fully explore the websites, complete key tasks, and provide accurate, unbiased responses without cognitive fatigue.
📋 ATTRIBUTES ANALYSIS:
To build accurate and meaningful personas, I began by analyzing the specific attributes that differentiate users—such as goals, behaviors, experience levels, frustrations, motivations, and usage patterns. This step helped reveal what truly matters to each group and which characteristics influence how they interact with the product. By identifying shared traits and key differences, we were able to understand the spectrum of user needs with clarity.
🔀 SEGMENTATION PROCESS:
Once the attributes were defined, I organized users into logical segments based on their common behaviors and expectations. The segmentation process grouped users in a way that highlighted their unique decision-making patterns, skill levels, and priorities. These segments served as the foundation for developing personas that accurately represent real user clusters, ensuring the design solutions address the needs of each group effectively.
👤 PERSONAS
After completing the Attribute Analysis and Segmentation Process, I identified clear patterns in user goals, behaviors, frustrations, and decision-making styles. These insights revealed distinct groups within the customer base, allowing us to define two primary personas—representing the highest-value and highest-frequency user segments—and two secondary personas, which captured important but less dominant segments.
The personas were created as evidence-based profiles, each grounded in real user needs and behavioral trends observed during research. These personas guided design decisions by helping the team stay aligned with user expectations, technical constraints, and business goals throughout the project.
📝 SCENARIOS:
With the personas established, I created detailed scenarios that illustrate how each persona would naturally interact with the Big O’ Tires website under real conditions. These scenarios helped contextualize their goals, challenges, motivations, and pain points, giving the team a clearer understanding of the user journey from start to finish.
The scenarios also ensured that every design solution was anchored in realistic behaviors rather than assumptions—bridging the gap between research insights and UX decision-making. They became an essential tool for validating flows, prioritizing features, and aligning stakeholders around the needs of the primary and secondary personas.
🗺️ CUSTOMER JOURNEY MAPS:
Using the insights gathered from the Usability Testing sessions and the behavioral patterns defined in the Personas, I created detailed Customer Journey Maps to visualize how each user type experiences the Big O’ Tires website from beginning to end. These journeys reveal not only what users do, but also what they think and feel at each step—highlighting moments of confusion, frustration, hesitation, or confidence.
By grounding the Journey Maps in real research data, each stage reflects authentic user behavior, pain points, motivations, and expectations. The maps made it easy to identify where users were getting stuck, where drop-offs occurred, and which touchpoints created friction or uncertainty. They also helped the team understand how emotional responses impacted decision-making during the booking and tire-selection process.
These Customer Journey Maps became a critical alignment tool for product, design, and business teams. They ensured that improvement opportunities were directly tied to user needs and validated insights—allowing us to prioritize solutions that would create the most meaningful impact across the user experience.
🚀 The Solution:
🧪 Prototype:
⚠️ CHALLENGES:
Redesigning the Big O’ Tires digital experience revealed several systemic challenges across all user segments and device types:
1. High friction during the vehicle-information step
Users consistently struggled to enter their vehicle details due to unclear labels, inconsistent field order, dropdown issues, and unexpected keyboard triggers. This early frustration created a negative emotional baseline that affected the rest of the journey.
2. Confusing and repetitive steps across the flow
Multiple mandatory steps—such as reconfirming tire size or re-entering information—were perceived as redundant. Users questioned why the flow forced them through actions unrelated to their primary goal, leading to frustration and perceived inefficiency.
3. Low transparency of tire specs, promos, and warranties
Users had difficulty finding tire specifications, understanding promotions, and comparing warranties. Important details were hidden behind clicks, scattered across different pages, or not shown at the right moment in the decision process.
4. Overwhelming and inconsistent results pages
The tire results view showed too much information at once and lacked clear filtering, sorting, and scanning hierarchy. Users could not easily compare products, leading to confusion, cognitive overload, and lower confidence in their purchase decisions.
5. Slow performance and loading times
Delays—especially in comparison pages or store-location lookups—created frustration, causing some users to restart the flow or abandon it entirely.
6. Additional services and fees created distrust
Users consistently reacted negatively when unexpected installation fees or add-ons appeared late in the flow. This impacted trust and reduced overall satisfaction.
7. Emotional drop in the mid-journey
All journey maps showed a noticeable emotional decline around the tire results, comparison, and quote steps. These moments—where buying confidence should increase—instead produced confusion and frustration.
📄 SUMMARY:
The research revealed that the Big O’ Tires digital experience struggles to support the user’s mental model across the tire-shopping journey. While users enter the website motivated by price, convenience, and warranty expectations, their experience quickly declines due to friction in basic tasks, lack of clarity in product details, and repeated interruptions in the purchase flow.
Across 120 participants and multiple rounds of competitor benchmarking, users consistently expressed:
High cognitive effort during early inputs
Low satisfaction with the results and comparison pages
Confusion with quotes and additional fees
Reduced confidence to buy compared to top competitors
A strong desire for clarity, speed, and transparency
Despite these challenges, the research uncovered a clear roadmap for improvement: simplifying the entry steps, improving sorting and filtering mechanisms, making specs and promotions instantly visible, reducing unnecessary steps, and increasing overall system speed.
👤 My Role
Product Designer
📦 Key Deliverables
Wireframes (Axure RP)
Interactive Prototypes (Axure RP)
Usability Testing Reports
Design Specifications
Personas
Customer Journey Maps
Hi-Fidelity UI Solution explained.
More Projects
UX Research
BIG-O-TIRES
BIG-O-TIRES
Year :
2020
Industry :
Automotive
Client :
TBC Corporation
Project Duration :
3 Months
Enter password to view case study
🛑 THE PROBLEM:
The goal of this research was to understand how consumers navigate and interact with the Big O Tires website compared to five direct competitors. By analyzing real user behavior and evaluating each site across key UX metrics—such as usability, learnability, visual design, performance, trust, and purchase confidence—the study aimed to uncover pain points, identify friction in the customer journey, and reveal opportunities to improve conversions and overall user satisfaction across all business units.
🔎 RESEARCH & FOUNDATIONS:
🏁 Competitors | 🎯 Target Users |
|---|---|
To understand how Big O Tires performs within its competitive landscape, we evaluated five major industry competitors offering similar products and services:
These competitors were selected based on market relevance, online traffic volume, product availability, national retail presence, and similarity in purchase flows. Evaluating their websites allowed us to benchmark best practices, identify UX gaps, and uncover opportunities for Big O Tires to differentiate its digital experience. | The study focused on real consumers within Big O Tires’ active service regions, ensuring the results reflected accurate customer behavior and purchasing expectations.
|
🌍 Geographical Coverage | ✔️ Task Flows Tested |
|---|---|
Participants were selected from all U.S. states where Big O Tires operates, including: This ensured the sample represented a broad, realistic mix of customers across different regions, climates, and store networks. | Users completed real purchase and service flows:
This combination of flows and metrics allowed us to capture both quantitative performance and qualitative user sentiment across all platforms. |
📊 Metrics Evaluated
To measure the effectiveness of each website and identify opportunities for improvement, we assessed all six platforms using standardized UX and behavioral metrics:
✔️ Usability: How easy it is for users to complete key tasks.
✔️ Learnability: How quickly new users understand the system.
✔️ Visual Aesthetics: How users perceive the visual design, branding, and UI clarity.
✔️ Confidence to Buy: How much trust the platform creates during the purchase process.
✔️ Consumer Satisfaction: How satisfied users feel with prices, offers, installation options, and overall value.
✔️ Consumer Preference: Which website users prefer—and why—based on their experience.
🔍 UX Research & Testing Methodology
To understand how Big O Tires performs compared to its competitors, a large-scale usability study was conducted involving 120 participants across desktop and mobile experiences. Because testing all five competitors in one session would overwhelm users and compromise the quality of their feedback, the evaluation was strategically divided into three rounds.
This structure ensured that each participant could fully explore the websites, complete key tasks, and provide accurate, unbiased responses without cognitive fatigue.
📋 ATTRIBUTES ANALYSIS:
To build accurate and meaningful personas, I began by analyzing the specific attributes that differentiate users—such as goals, behaviors, experience levels, frustrations, motivations, and usage patterns. This step helped reveal what truly matters to each group and which characteristics influence how they interact with the product. By identifying shared traits and key differences, we were able to understand the spectrum of user needs with clarity.
🔀 SEGMENTATION PROCESS:
Once the attributes were defined, I organized users into logical segments based on their common behaviors and expectations. The segmentation process grouped users in a way that highlighted their unique decision-making patterns, skill levels, and priorities. These segments served as the foundation for developing personas that accurately represent real user clusters, ensuring the design solutions address the needs of each group effectively.
👤 PERSONAS
After completing the Attribute Analysis and Segmentation Process, I identified clear patterns in user goals, behaviors, frustrations, and decision-making styles. These insights revealed distinct groups within the customer base, allowing us to define two primary personas—representing the highest-value and highest-frequency user segments—and two secondary personas, which captured important but less dominant segments.
The personas were created as evidence-based profiles, each grounded in real user needs and behavioral trends observed during research. These personas guided design decisions by helping the team stay aligned with user expectations, technical constraints, and business goals throughout the project.
📝 SCENARIOS:
With the personas established, I created detailed scenarios that illustrate how each persona would naturally interact with the Big O’ Tires website under real conditions. These scenarios helped contextualize their goals, challenges, motivations, and pain points, giving the team a clearer understanding of the user journey from start to finish.
The scenarios also ensured that every design solution was anchored in realistic behaviors rather than assumptions—bridging the gap between research insights and UX decision-making. They became an essential tool for validating flows, prioritizing features, and aligning stakeholders around the needs of the primary and secondary personas.
🗺️ CUSTOMER JOURNEY MAPS:
Using the insights gathered from the Usability Testing sessions and the behavioral patterns defined in the Personas, I created detailed Customer Journey Maps to visualize how each user type experiences the Big O’ Tires website from beginning to end. These journeys reveal not only what users do, but also what they think and feel at each step—highlighting moments of confusion, frustration, hesitation, or confidence.
By grounding the Journey Maps in real research data, each stage reflects authentic user behavior, pain points, motivations, and expectations. The maps made it easy to identify where users were getting stuck, where drop-offs occurred, and which touchpoints created friction or uncertainty. They also helped the team understand how emotional responses impacted decision-making during the booking and tire-selection process.
These Customer Journey Maps became a critical alignment tool for product, design, and business teams. They ensured that improvement opportunities were directly tied to user needs and validated insights—allowing us to prioritize solutions that would create the most meaningful impact across the user experience.
🚀 The Solution:
🧪 Prototype:
⚠️ CHALLENGES:
Redesigning the Big O’ Tires digital experience revealed several systemic challenges across all user segments and device types:
1. High friction during the vehicle-information step
Users consistently struggled to enter their vehicle details due to unclear labels, inconsistent field order, dropdown issues, and unexpected keyboard triggers. This early frustration created a negative emotional baseline that affected the rest of the journey.
2. Confusing and repetitive steps across the flow
Multiple mandatory steps—such as reconfirming tire size or re-entering information—were perceived as redundant. Users questioned why the flow forced them through actions unrelated to their primary goal, leading to frustration and perceived inefficiency.
3. Low transparency of tire specs, promos, and warranties
Users had difficulty finding tire specifications, understanding promotions, and comparing warranties. Important details were hidden behind clicks, scattered across different pages, or not shown at the right moment in the decision process.
4. Overwhelming and inconsistent results pages
The tire results view showed too much information at once and lacked clear filtering, sorting, and scanning hierarchy. Users could not easily compare products, leading to confusion, cognitive overload, and lower confidence in their purchase decisions.
5. Slow performance and loading times
Delays—especially in comparison pages or store-location lookups—created frustration, causing some users to restart the flow or abandon it entirely.
6. Additional services and fees created distrust
Users consistently reacted negatively when unexpected installation fees or add-ons appeared late in the flow. This impacted trust and reduced overall satisfaction.
7. Emotional drop in the mid-journey
All journey maps showed a noticeable emotional decline around the tire results, comparison, and quote steps. These moments—where buying confidence should increase—instead produced confusion and frustration.
📄 SUMMARY:
The research revealed that the Big O’ Tires digital experience struggles to support the user’s mental model across the tire-shopping journey. While users enter the website motivated by price, convenience, and warranty expectations, their experience quickly declines due to friction in basic tasks, lack of clarity in product details, and repeated interruptions in the purchase flow.
Across 120 participants and multiple rounds of competitor benchmarking, users consistently expressed:
High cognitive effort during early inputs
Low satisfaction with the results and comparison pages
Confusion with quotes and additional fees
Reduced confidence to buy compared to top competitors
A strong desire for clarity, speed, and transparency
Despite these challenges, the research uncovered a clear roadmap for improvement: simplifying the entry steps, improving sorting and filtering mechanisms, making specs and promotions instantly visible, reducing unnecessary steps, and increasing overall system speed.
👤 My Role
Product Designer
📦 Key Deliverables
Wireframes (Axure RP)
Interactive Prototypes (Axure RP)
Usability Testing Reports
Design Specifications
Personas
Customer Journey Maps
Hi-Fidelity UI Solution explained.